
Reports that show you how your agency is really doing.
Cosmentum ships with reports that answer the questions an agency owner actually asks: who is behind, what the book is worth, which deals went cold, and what changed since March.
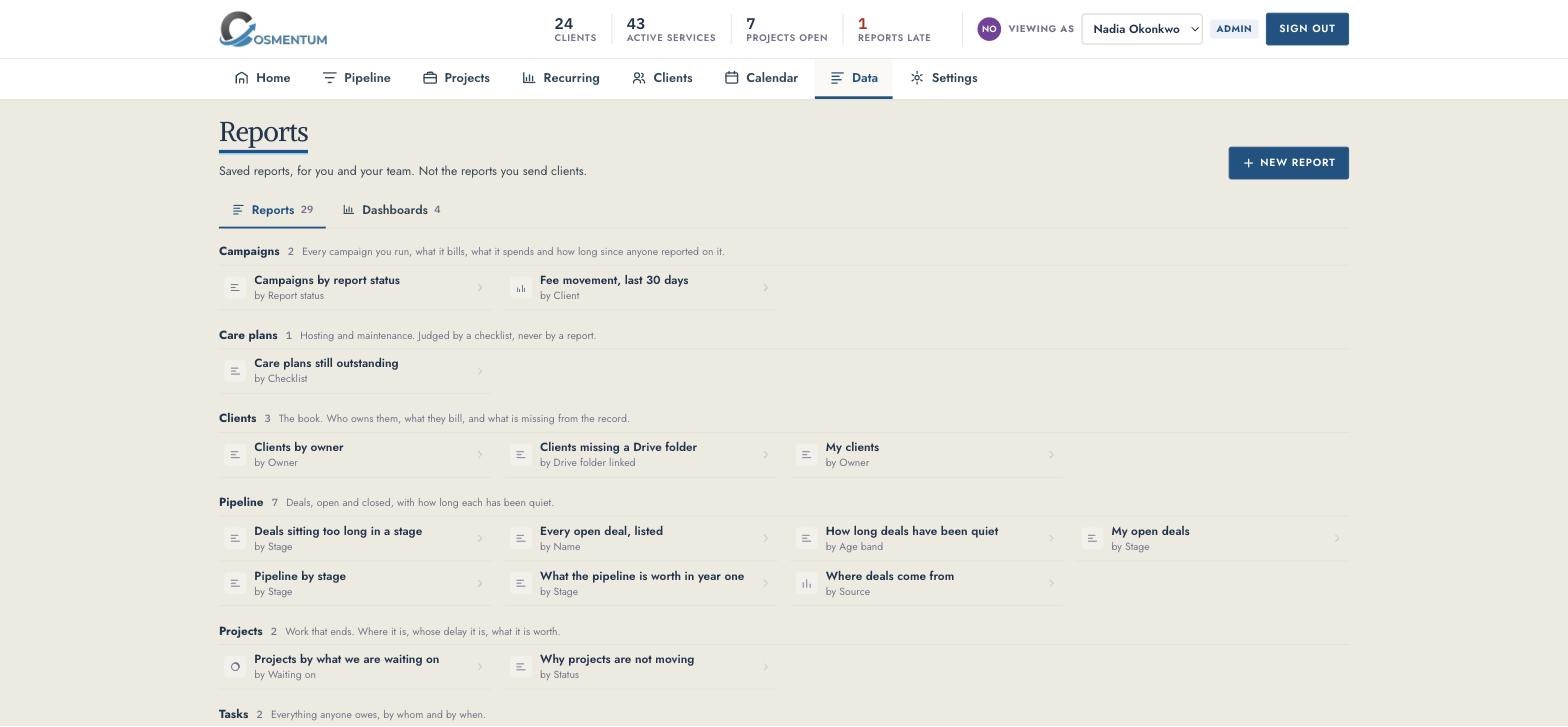
See what any number was on any past date
Because nothing is overwritten, any report can be rewound. Fees, stages, owners and dates roll back to what they were. Derived numbers like how late the reporting is always read as of today, and the report says so under the chart.
Recurring revenue over time is the payoff. Most tools snapshot revenue on the day someone thought to start snapshotting. Cosmentum rebuilds it month by month from the change history, so a fee that went from $500 to $1,500 in June shows $500 in May and $1,500 in June, and the chart is right back to the first record you ever entered.
Three shapes of report. A summary groups rows, optionally broken down a second level with subtotals. A matrix crosses rows with columns, the way fee by service across owners does. A table drops grouping and lists the records with the columns you pick. Count, total, average, largest or smallest.
Any field is a dimension. A picklist or checkbox you added to a record type can be grouped on, because every field has a typed column behind it.
Dashboards are made of reports. Pin any saved report as a panel. Each panel runs against the seat looking at it, so the owner overview reads the whole book for the owner and one rep's clients for that rep, with no second dashboard to maintain.
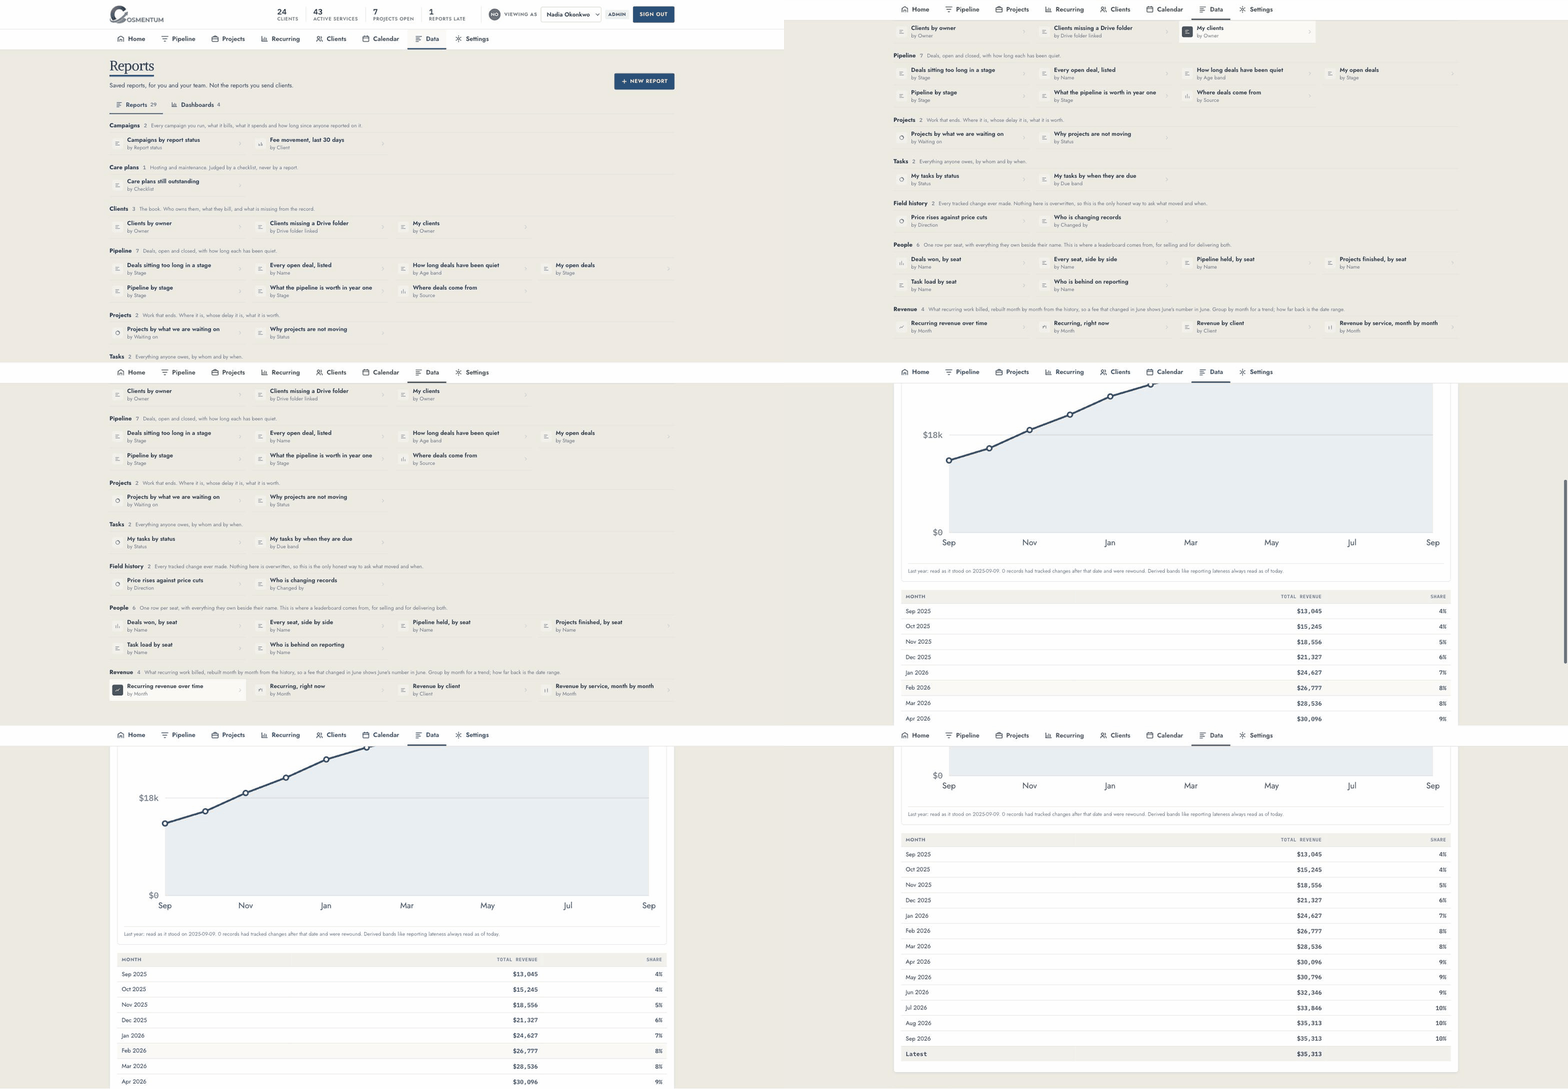
Build a report in under a minute, and watch it run before you save it
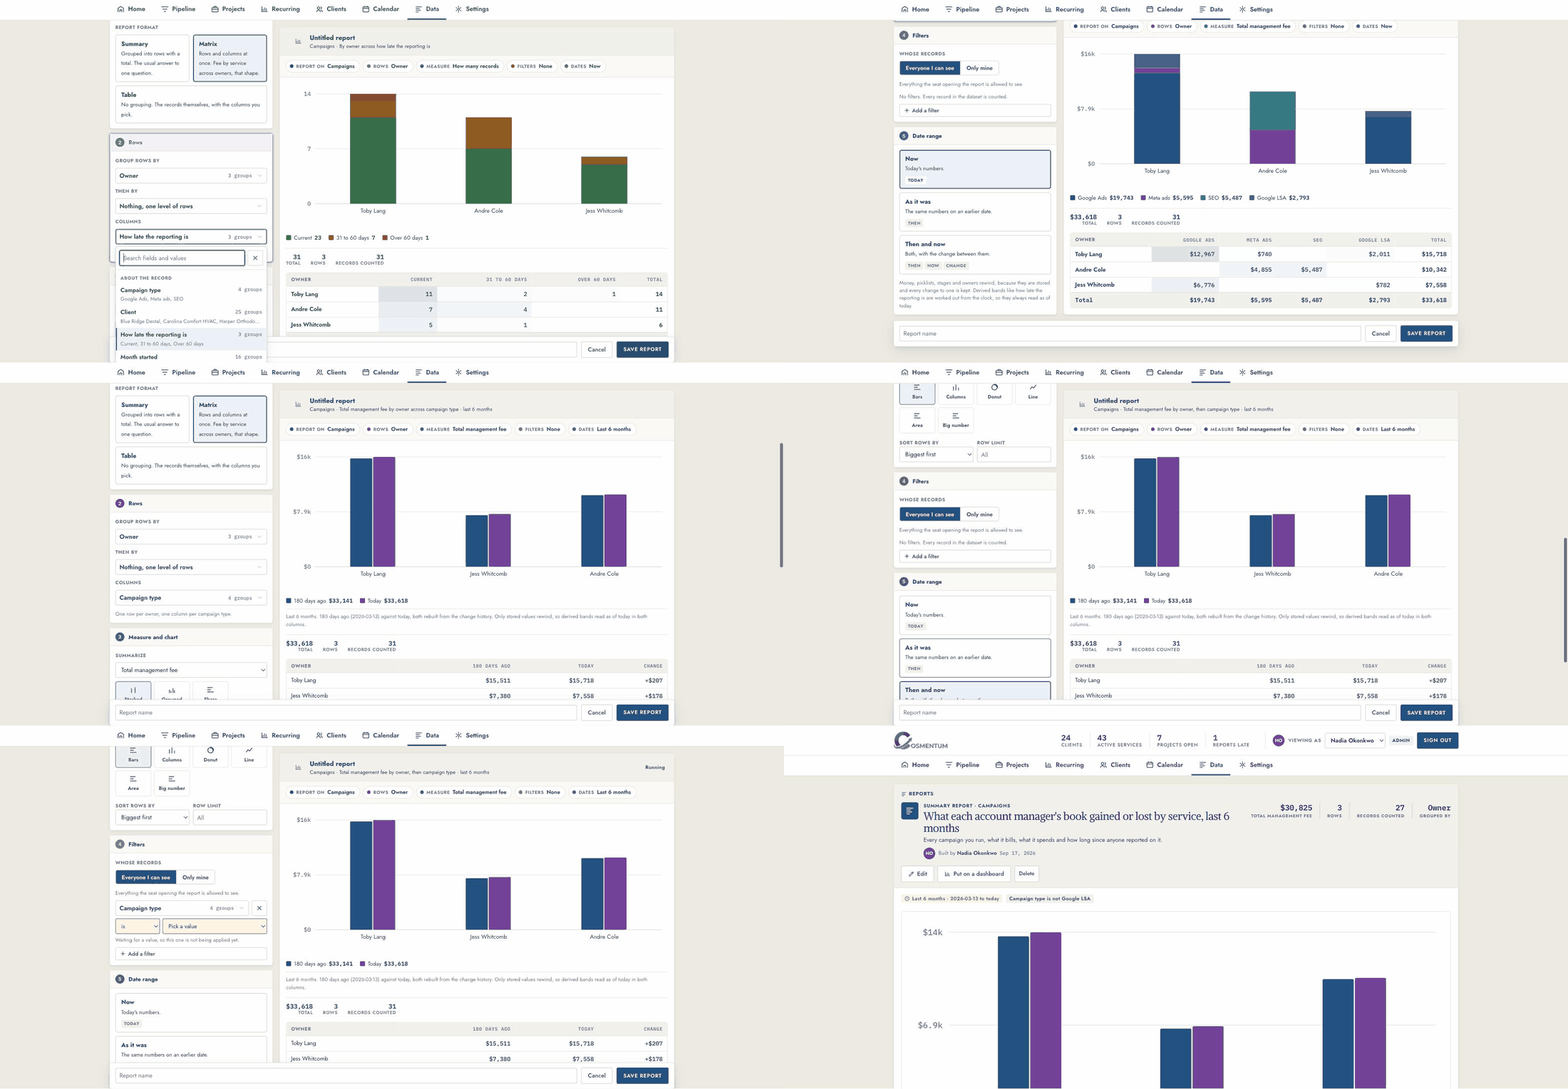
Pick what to report on, how to group it, what to measure, and the date range. Every change reruns against your real data as you make it, so you see the answer before you name the report.
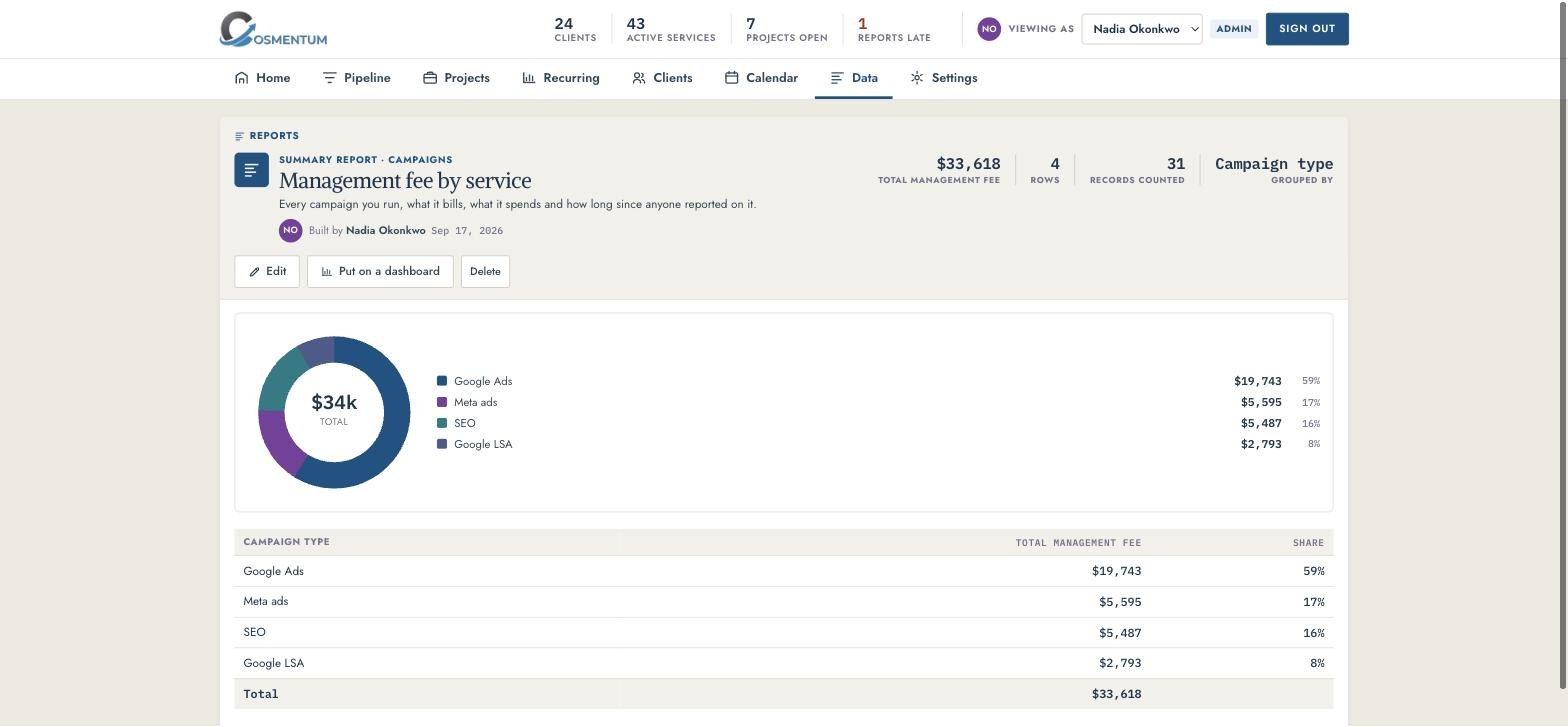
Management fee by service
Report on campaigns. Group the rows by campaign type. Measure the total management fee. Pick a donut. Name it and save. Under a minute, and it lands in your reports list next to the ones that ship with the product.
- 01Report on: Campaigns
Every campaign you run, what it bills and what it spends.
- 02Rows: Campaign type
Google Ads, Meta ads, SEO, Google LSA.
- 03Measure: Total management fee
Any number field on the record can be totaled, averaged, or ranked.
What each account manager's book gained or lost in the last six months
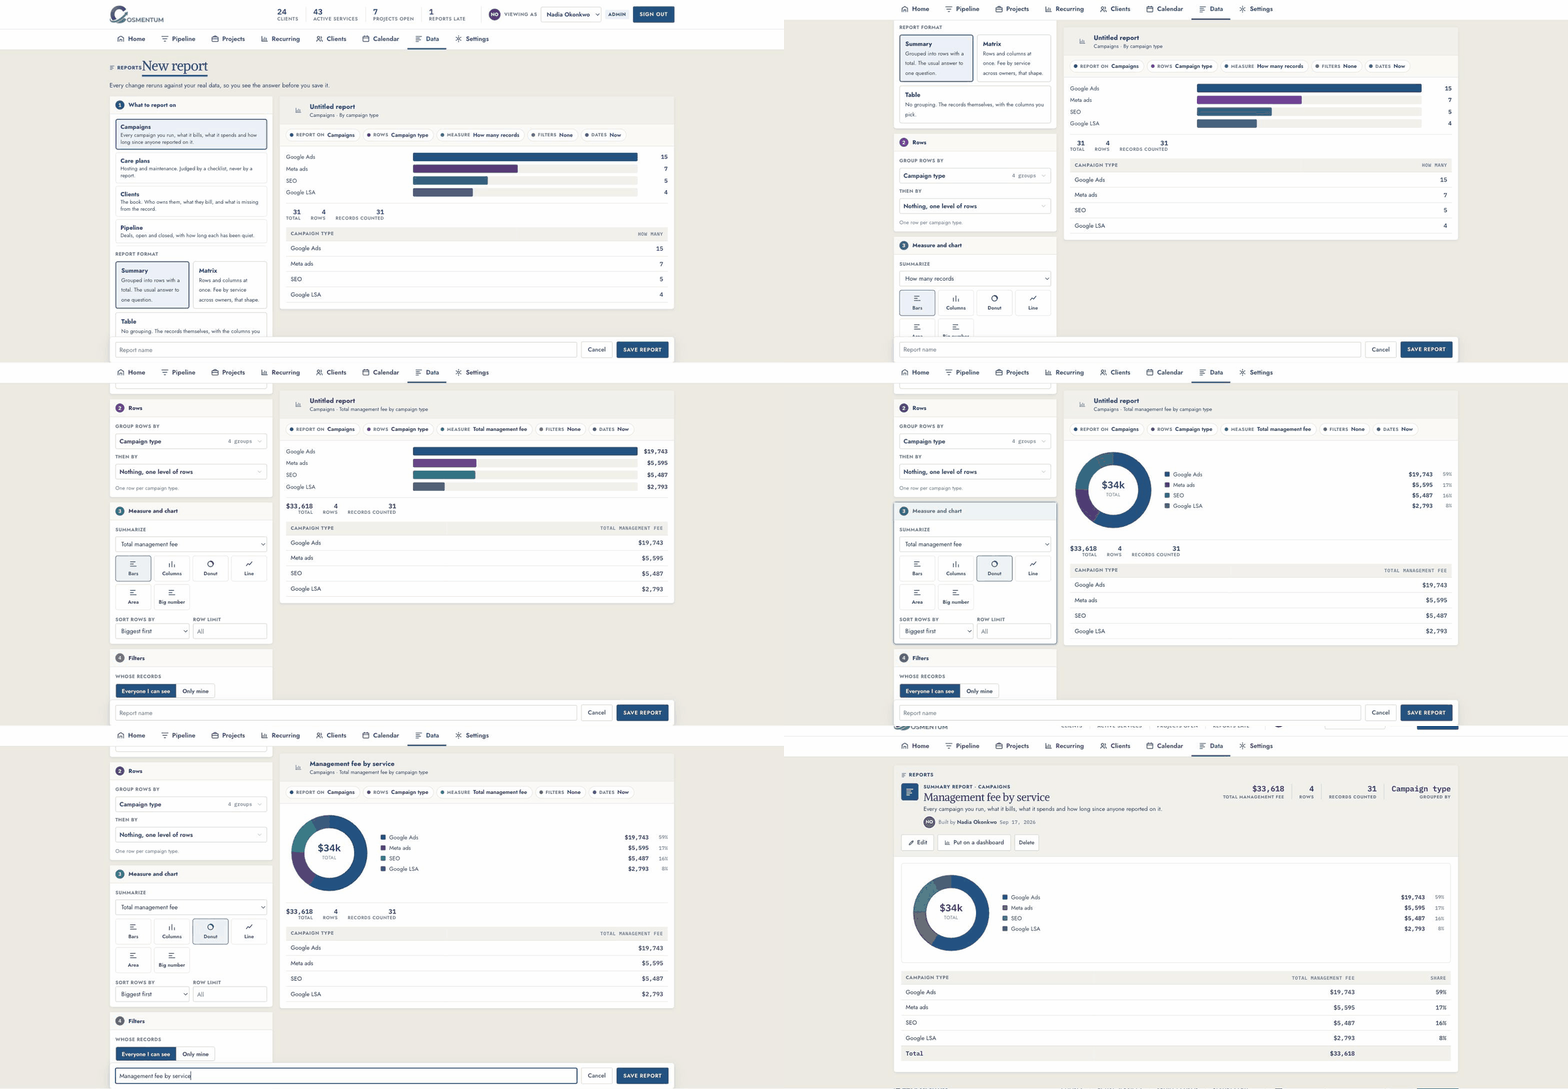
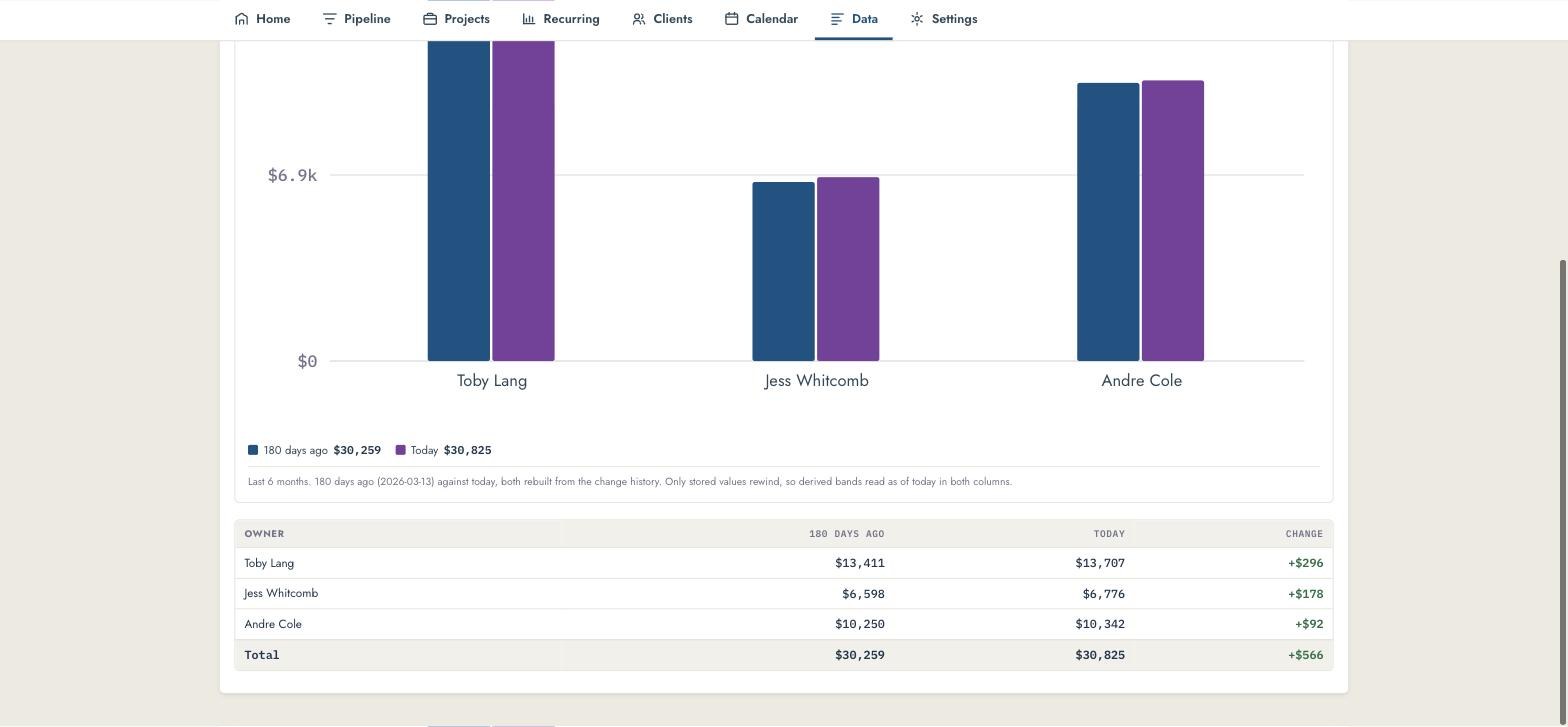
Every account manager's fees today, next to what those same fees were 180 days ago, with the change. Filtered to leave out Local Services Ads. Both columns are rebuilt from the history of every fee change, not from a snapshot somebody remembered to take.
Why a CRM cannot do this
A CRM stores the fee that is on the record right now. Change it and the old number is gone. To know what a book was worth in March you would need a spreadsheet someone kept by hand, and it would not know about the two fees that changed in May.
Cosmentum keeps every change to every fee, stage, owner and date. So any report can be asked to read as of a date, or as of two dates with the difference between them. The report above is four choices in the builder: rows by owner, total management fee, one filter, and a rolling 180 day window. It reruns every time it opens, so it is never stale.
- 01Rows: Owner. Measure: total management fee.
One row per account manager, with the book they carry.
- 02Filter: campaign type is not Google LSA.
Any field, any operator. The filter shows on the saved report so nobody misreads it.
- 03Dates: then and now, 180 days back.
Then, now and the change, worked out again every time the report runs.
- 04Put it on a dashboard.
Each account manager's home shows only their own row.
Every report included with Cosmentum
Campaigns
Every campaign you run, what it bills, and how long since anyone reported on it.
- Average fee by service
- Campaigns by report status
- Conversion tracking coverage
- Fee by client, split by service
- Fee movement, last 30 days
- Fee movement, last 90 days
- Reporting lateness by owner
- What each owner's book is made of
- What the book was worth three months ago
Revenue
What recurring work billed, rebuilt month by month from the history.
- Recurring revenue over time
- Recurring, right now
- Revenue by client
- Revenue by service, month by month
Care plans and clients
Hosting and maintenance, and the book itself.
- Care plans still outstanding
- Clients by owner
- Clients missing a Drive folder
- My clients
Pipeline
Deals, open and closed, with how long each has been quiet.
- Deals by age and stage
- Deals sitting too long in a stage
- Every open deal, listed
- How long deals have been quiet
- My open deals
- Pipeline by stage
- What the pipeline is worth in year one
- Where deals come from
People
One row per seat, with everything they own beside their name. This is where a leaderboard comes from.
- Deals won, by seat
- Every seat, side by side
- Pipeline held, by seat
- Projects finished, by seat
- Task load by seat
- Who is behind on reporting
Projects, tasks and history
- Projects by what we are waiting on
- Why projects are not moving
- My tasks by status
- My tasks by when they are due
- Price rises against price cuts
- Who is changing records
Every report is included, starting free.
Starter is free for up to 50 paying clients. Founder 25 seats are $18 a month for life.